Monitor the appliance with the Admin Console - Analytics Platform System
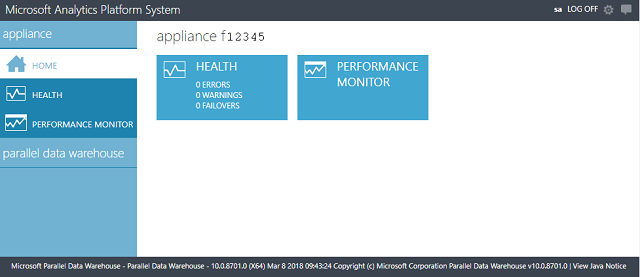
The Admin Console is a SQL Server PDW web application that surfaces the appliance state, health, and performance information. Users connect to the Admin Console through Internet Explorer.
About the Admin Console

Appliance
Home
Provides a quick summary of the appliance state.
Health
Displays the appliance topology with indicators showing the health of each monitored component within each node. Allows you to view the current status of individual nodes and properties of the node components.
Displays hardware and software alerts.
Performance Monitor
Displays performance monitor graphs.
Parallel Data Warehouse
Home
Provides a quick summary of the PDW state.
Sessions
Displays active PDW user sessions. This can help for monitoring resource contention.
Queries
Displays a list of running queries and recently completed queries. It displays related errors, if any. Also provides the ability to view details of the query execution plan and node execution information.
Loads
Displays load plans, the current state of PDW loads, and related errors, if any.
Backups/Restores
Displays a log of PDW backup and restore operations.
Health
Displays the PDW topology with indicators showing the health of each monitored component within each node. Allows you to view the current status of individual nodes and properties of the node components.
Displays hardware and software alerts.
Resources
Displays a list of PDW resource locks and their current status.
Storage
Summarizes the PDW storage utilization.
Performance Monitor
Displays PDW performance monitor graphs.
Note
The admin console has a 1024x768 screen resolution. The admin console displays best with a screen resolution of 1280 X 1024 or higher.
Connect to the Admin Console
To connect to the Admin Console, requires:
At least Internet Explorer version 10.
Permissions to access the Admin Console.
The IP address of the Control node cluster. Obtain this from your SQL Server PDW administrator.
To connect to the Admin Console, use Internet Explorer and https to browse to the IP address of the Control node cluster. For example, if the IP address of the Control node cluster is 10.192.63.102, enter https://10.192.63.102 in your browser address bar. The first screen will request your LOGIN and PASSWORD. Provide either a SQL Server Authentication login and password, or a Windows Authentication login and Windows password. If using a Windows Authentication login, the Admin Console will use impersonation.
Admin Console Tasks
The Admin Console provides the ability to monitor the following:
| Information Type | How to Access in the Admin Console |
|---|---|
| Overall status of the appliance | Click Appliance State in the top menu, or Home. |
| Alerts | Click Alerts. For more information, see Understanding Admin Console Alerts (Analytics Platform System). |
| Appliance components and their status | Click Appliance State in the top menu, or Home. |
| Monitor requests (including queries, loads, backups, and restores) | Click Sessions to see currently active or recent sessions. Click Queries to see currently active or recent queries. The information displayed for queries includes loads, backups, and restores. Click Locks to see active locks. |
| Monitor additional information for loads, backups, and restores. | Click Loads or Backups/Restores. |
| Performance information | Click Performance Monitor. |
See Also
Feedback
Coming soon: Throughout 2024 we will be phasing out GitHub Issues as the feedback mechanism for content and replacing it with a new feedback system. For more information see: https://aka.ms/ContentUserFeedback.
Submit and view feedback for