Exercise 3 - Track Driver Footprint and Dynamic Allocations During Boot
Pool is the memory resource for kernel mode components that the OS and device drivers use to store their data structures. Pool has four basic allocation areas:
Non Paged Pool: Allocations guaranteed to reside in physical memory.
Paged Pool: Allocations that can be paged out of memory to the pagefile.
NX Non Pageable Pool: Non-paged allocations, which are not executable.
Session pool: Allocations made per session. These are pageable.
Pool usage is a significant contributor to the overall memory usage on a machine – it is the largest consumer of memory immediately after boot. Any reduction in Pool usage reduces the overall memory usage of the system across the OS, with non-pageable memory being the highest priority category to drive reductions (for).
In this exercise, you’ll review inbox Microsoft driver allocations and their footprint (at their initialization time) during boot.
Step 1: Gather a pool memory trace across a boot transition
In this step, you’ll gather a boot trace using Windows Performance Recorder (WPR) that contains pool and resident set data.
Open WPR from the Start menu
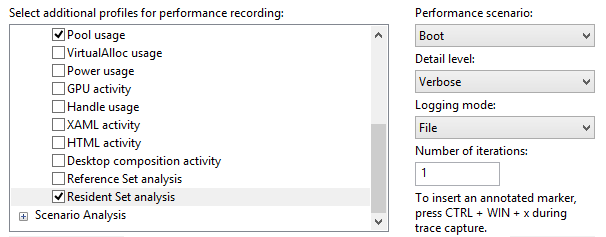
Select the right event providers:
Pool usage
Resident Set
First Level Triage
Select boot as the performance scenario.
Select File as the logging mode.
Set 1 as the Number of Iterations.
Click Start and then select a location to save the ETL file.
The system automatically reboots, gathers a trace, and stops after the desktop becomes visible.
Step 2: Review pool data using WPA
The Pool data is exposed via the Pool Graph summary table in WPA. The key columns of interest are in the following table.
You can add or remove columns if you right-click on the column headers.
| Terminology | Description |
|---|---|
| Pool Tag | The tag associated with a pool allocation. |
| Pool Tag Module | The module (driver) associated with a pool tag. |
| Stack | Shows the code path on a thread leading to a memory allocation. |
| Paged | Indicates whether or not the allocations were placed into a Paged Pool or Non-Paged Pool. |
| Impacting type | Shows whether an allocation contributes to the steady state memory usage or is a transient allocation. |
Open the trace you captured in Step 1 with WPA.
Open the Trace menu and select Configure symbols path.
- Specify the path of the symbol cache. For more information on symbols, see the Symbol Support page on MSDN.
Open the Trace menu and select Load symbols.
Find the Pool graph in the Memory category of the Graph Explorer
Drag and drop the Pool graph onto the Analysis tab.
Organize the table to show these columns:
Pool tag module
Paged
Impacting type
Stack
Pool tag
Count
Impacting Size and Size
**Note on Pool Tags: **
If you’re a driver developer, make sure that the pool tags used by your driver are clear and easily identifiable to facilitate analysis. For example, if your company name is Fabrikam, you could add a “Fbk” prefix to all pool tags: FbkPool1, FbkPool2, FbkBuffer, etc.
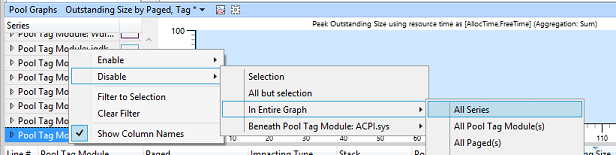
Disable all series on the graph (Right-click -> Disable -> In Entire Graph -> All Series)
Sort by impacting size by clicking on the Impacting Size column header.
Drivers that have the highest steady state memory usage display at the top.
Step 3: Intercept pool allocation data
Zoom into the first 30 seconds of the timeline.
Select one driver (for example, ACPI.sys, but any will do).
Review the NonPaged memory and expand the row.
NonPaged memory should be the focus of your investigations as it can’t be moved to the pagefile when there’s memory pressure on the system.
Enable the Legend for the Impacting and Transient categories.
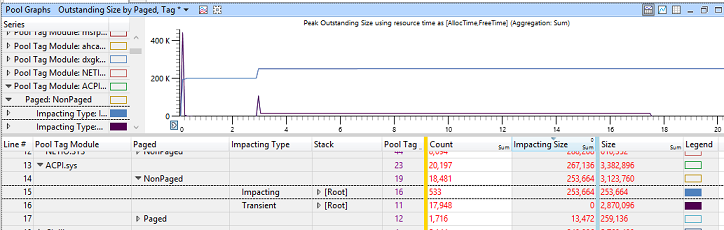
Sort by Impacting Size by clicking on the column header.
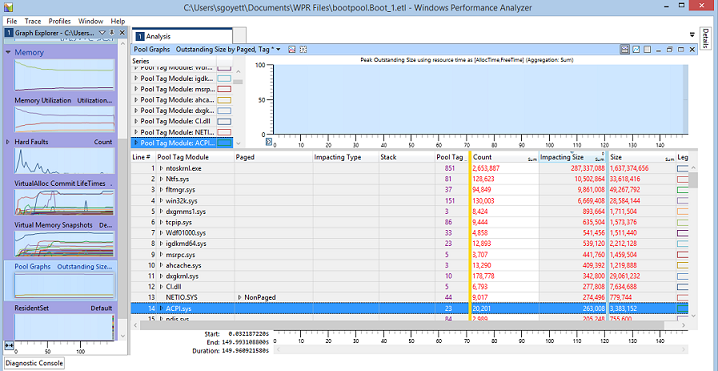
Impacting memory directly contributes to the overall memory footprint of the driver at all times. In the preceding example, you can tell that ACPI.sys uses some non-paged memory at all times, and that this steady state usage increases twice (first when the driver is loading, then a second time at around 3 seconds).
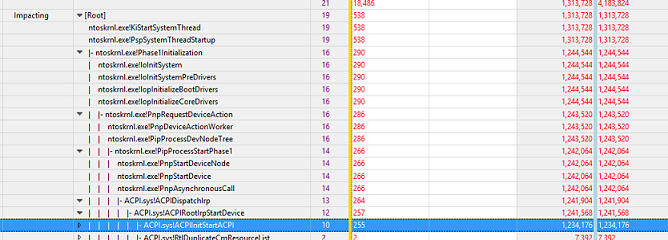
Expand the stack and navigate through it. At the top, you should see function calls that lead to the largest steady state pool allocations.
In the following example, you can see that ACPI.sys makes a total of 255 pool allocations, totaling 1.2 MB under the ACPIInitStartACPI function. This is where the driver developer should focus in order to improve the driver steady state memory usage, as this function accounts for most of the driver allocations.
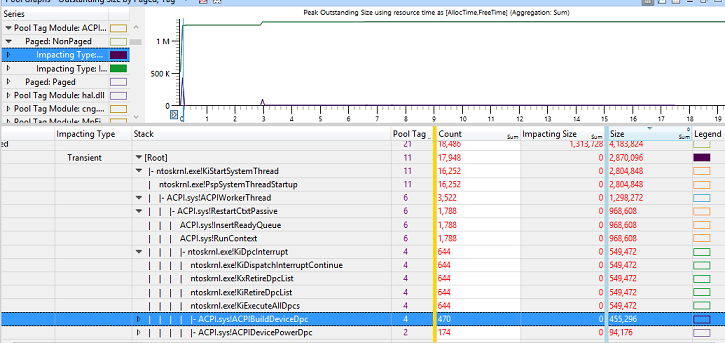
Sort by Size by clicking on the column header.
Do the same thing for the Transient category. Expand the stack and navigate through it. At the top, you should see function calls leading to the largest transient pool allocations.
In the following example, you can see the initial spike of transient memory usage is mainly caused by ACPI executing DPCs of devices (ACPI.sys!ACPIBuildDeviceDpc). The spike that introduced the code under this function call totals 455 KB.
Step 4: Measure the driver code footprint
Find the Resident Set graph in the Memory category of the Graph Explorer.
Drag and drop the Resident Set graph onto the Analysis tab.
Make sure to unzoom the graph (Ctrl+Shift+”-“).
Select the File Backed Page graph preset.
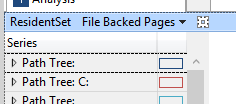
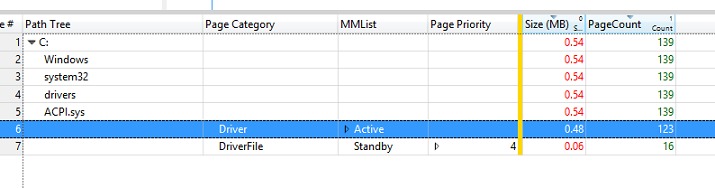
Through the path tree column, navigate to the driver you selected in Step 3 (for example, ACPI.sys under C:/Windows/drivers).
Expand the Driver category and focus on the Active pages.
The value in the Size column represents the impact the driver code has on the memory footprint. In the following example, it is 0.48 MB.