
GitHub Copilot and Visual Studio 2022
Get more done with your AI pair programmer
Stay in your flow and complete tasks faster with the help of multi-line suggestions prompted by your code and code comments. Building new functionality, writing unit tests, and learning new technologies has never been easier or more fun.
GitHub Copilot for Business adds security vulnerability filtering, proxy support, and industry leading privacy.
Meet the Visual Studio family
Visual Studio

The most comprehensive IDE for .NET and C++ developers on Windows. Fully packed with a sweet array of tools and features to elevate and enhance every stage of software development.

Visual Studio Code

![]()

A standalone source code editor that runs on Windows, macOS, and Linux. The top pick for JavaScript and web developers, with extensions to support just about any programming language.
By using Visual Studio Code you agree to its license & privacy statement
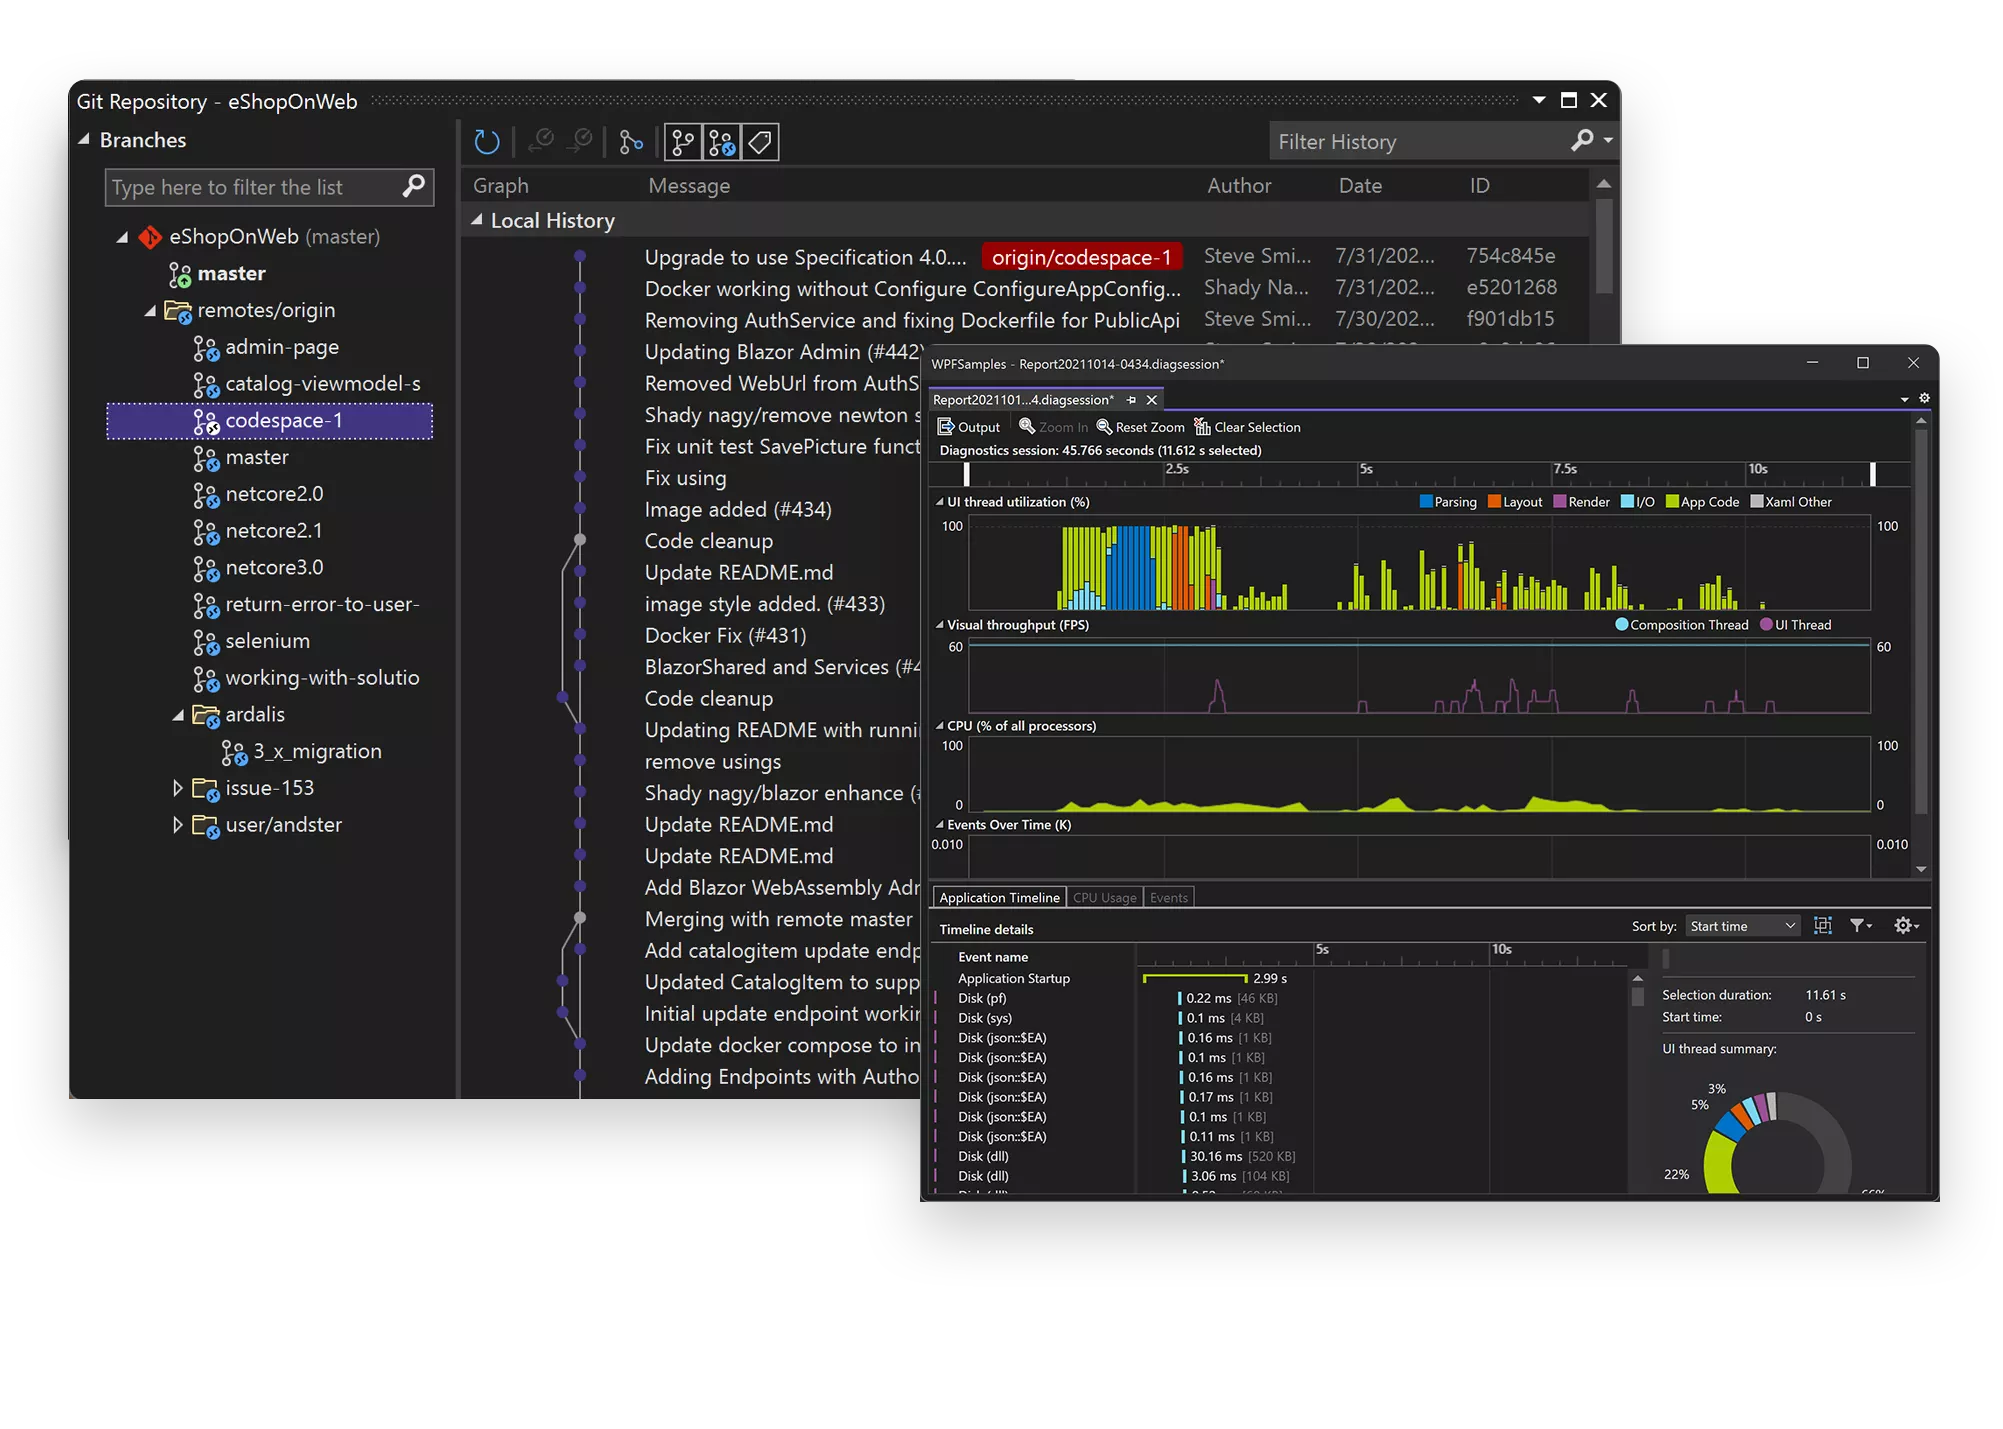
Visual Studio 2022
The Visual Studio IDE is a creative launching pad that you can use to edit, debug, and build code, and then publish an app. Over and above the standard editor and debugger that most IDEs provide, Visual Studio includes compilers, code completion tools, graphical designers, and many more features to enhance the software development process.
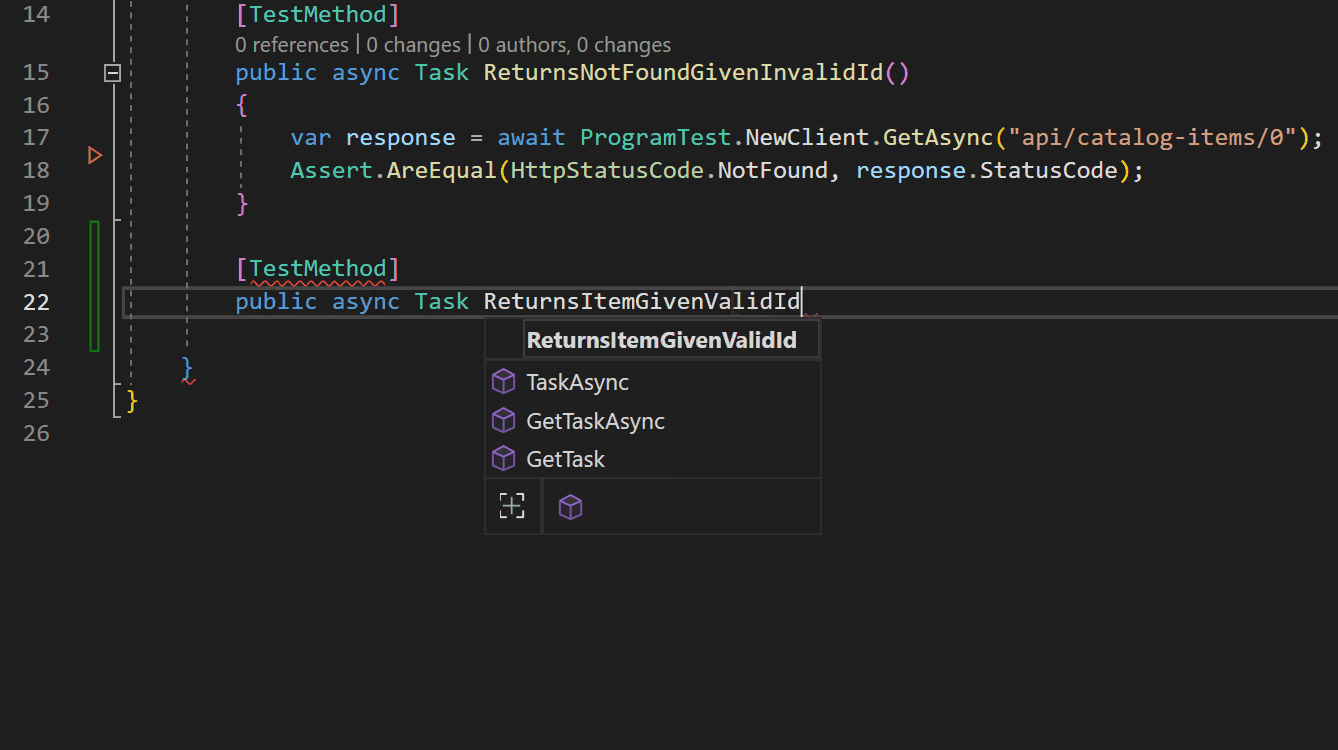
Code faster
Work smarter
Visual Studio is the fastest IDE for productivity. Target any platform, any device. Build any type of application. Work together in real time. Diagnose and stop problems before they happen. It makes the stuff you do every day more fluid and responsive.
Visual Studio Code
Visual Studio Code is a lightweight but powerful source code editor which runs on your desktop and is available for Windows, macOS and Linux. It comes with built-in support for JavaScript, TypeScript and Node.js and has a rich ecosystem of extensions for other languages and runtimes (such as C++, C#, Java, Python, PHP, Go, .NET).
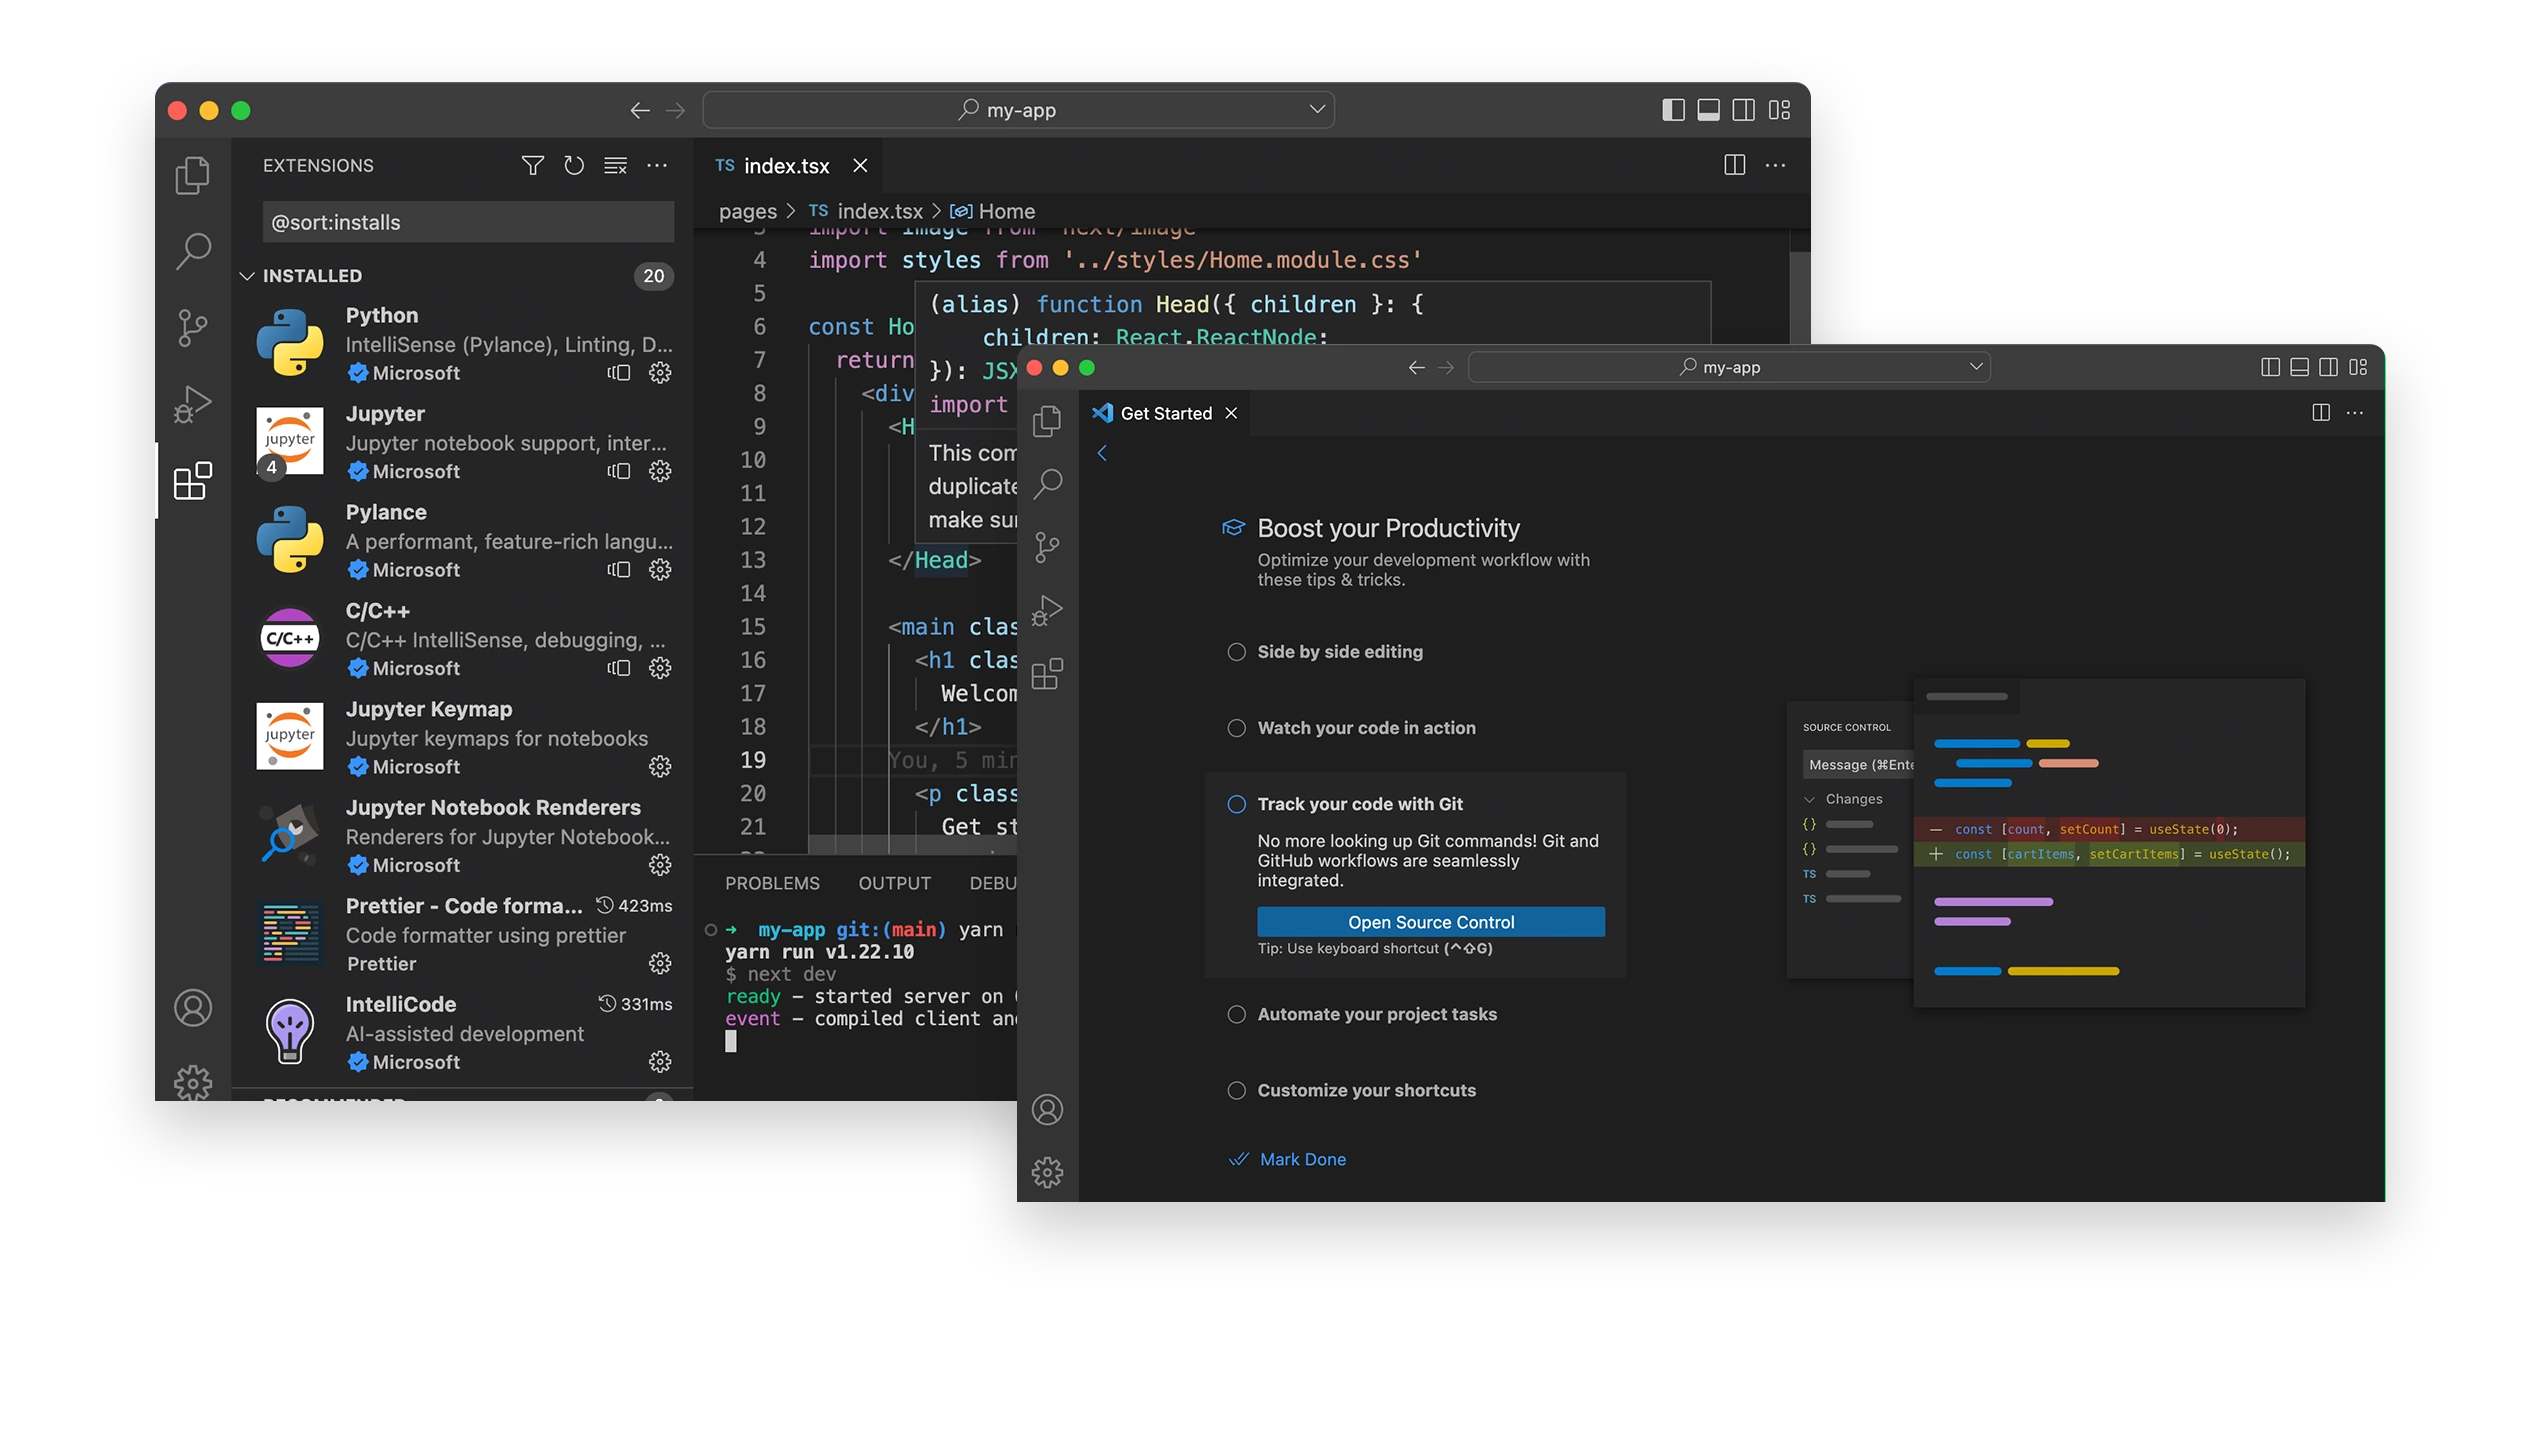
Code editing. Redefined
Debug code right from the editor. Launch or attach to your running apps and debug with break points, call stacks, and an interactive console.
Take it further with extensions
Extensions are add-ons that customize and enhance Visual Studio, including extra settings, features, or uses for existing tools. With thousands of extensions on the marketplace, you’ve got options galore to increase your productivity and cater to your workflow.


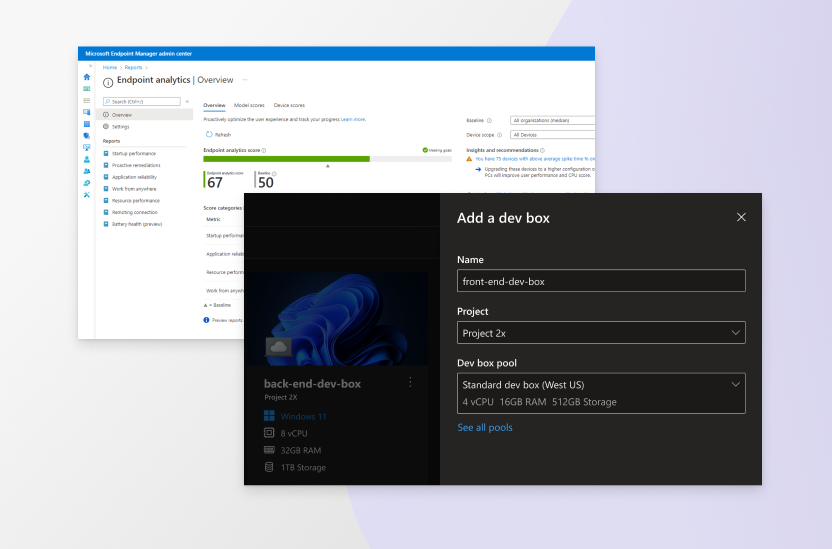
Visual Studio Subscriptions
Get more from Visual Studio with a subscription! Get access to platforms like Azure, training, and more for your team.
- Latest and past versions of Visual Studio
- Discounts on Azure services when used for dev/test purposes
- DevOps services to support your development workflow
- Monthly Azure credits to learn, experiment, and prototype
- Access Microsoft’s entire catalog of software for dev/test use
- Training resources like Pluralsight and LinkedIn Learning
- Technical support incidents for your dev/test issues
A product family that’s earned your trust
Millions of developers from teams and organizations of all sizes rely on Visual Studio products to make their software.


Visual Studio
Visual Studio Code


